
 Census – Facts for Features – Native Americans
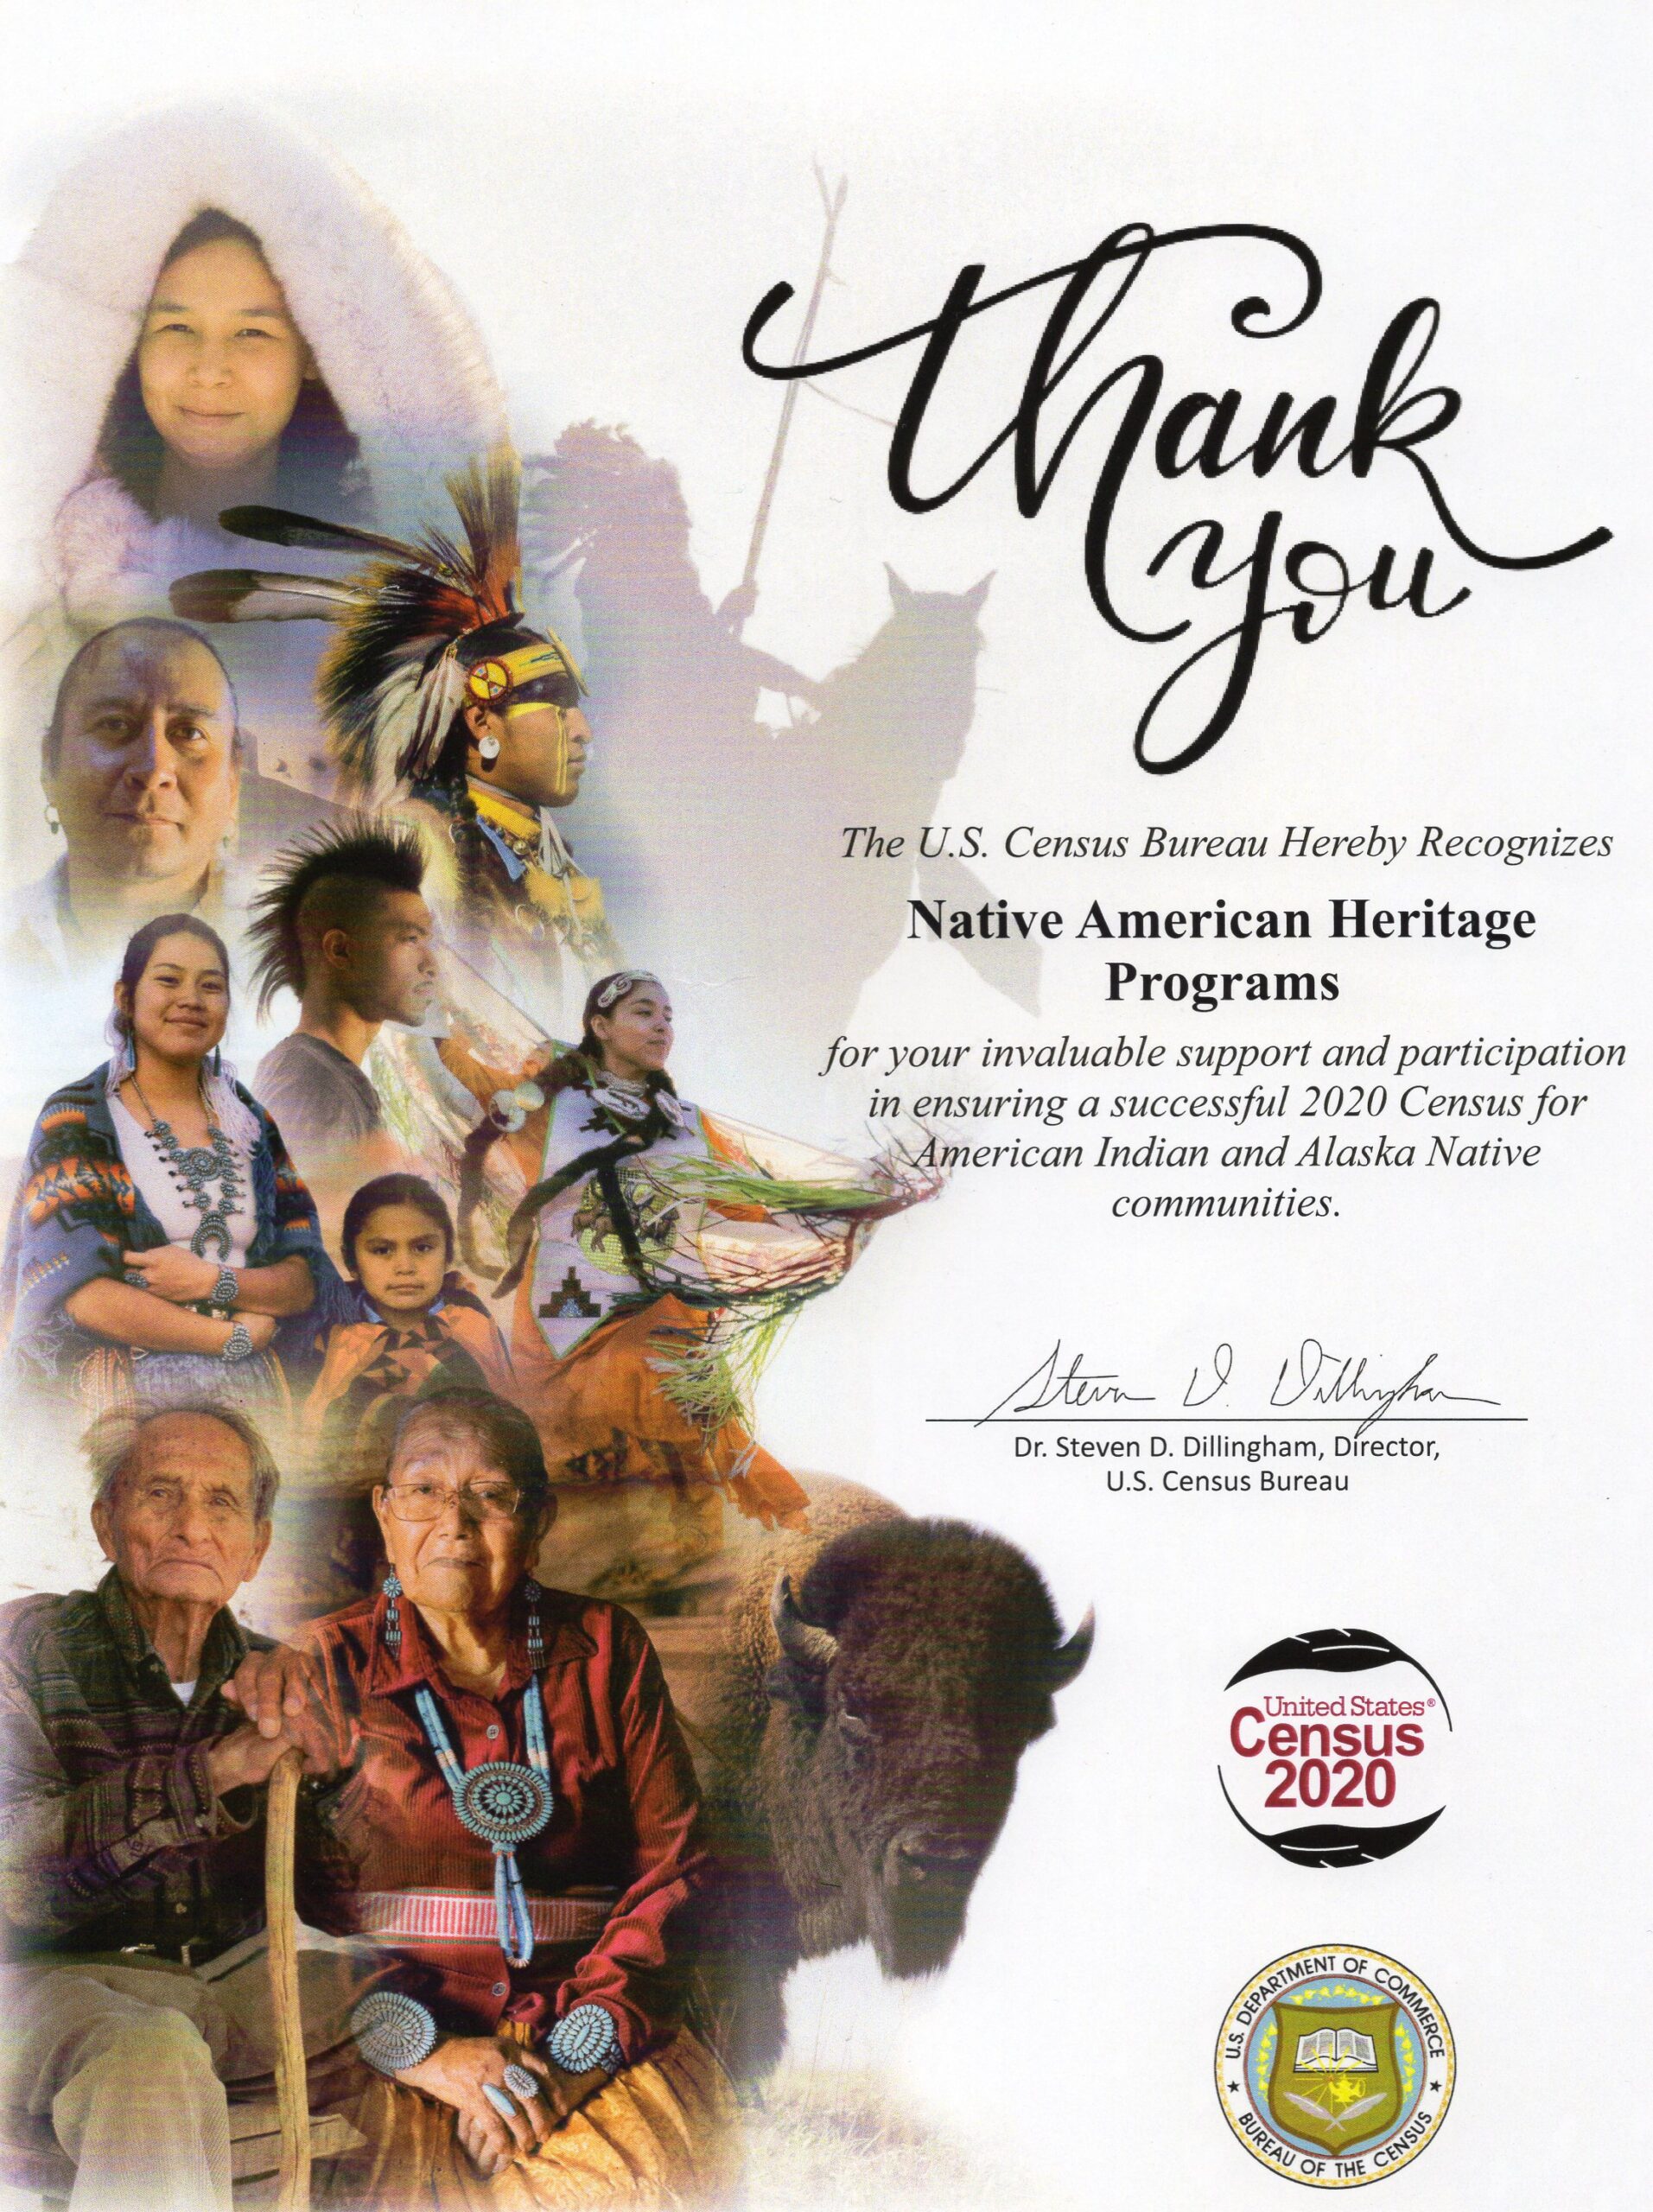
 Native American Heritage Programs was a Complete Count Census Partner in 2010 & again in 2020! REMEMBER: Native Americans Count! It’s in our hands to shape our future!
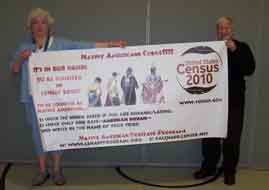
Holding the Banner – Carla Messinger & Barrie Cox-Dacre visiting from the UK.
To be counted Check NO when ask if you are Hispanic/Latino. Check only ONE RACE – American Indian– AND write the name of your tribe! Federal funding for schools, elder care, roads, and other improvements in your community depends on the number of people counted in the census. Don’t lose out! The children of tomorrow depend on you!
Please Note: These are older Facts!
In depth information follows 2010 Census Facts, stats on Health Disparities at the end.
Census Facts November 2010
As in previous Novembers, the U.S. Census Bureau has released a collection of data on American Indians and Alaska Natives (AI/AN).
Here are few:
Native American Population: 5 million (as of July 1, 2009), making up 1.6 percent of the total population Web Editors Note: Still only 2% of US population.
Projected Population in 2050: 8.6 million, comprising 2 percent of the total population
Median Age: 29.7
State with Largest Native American Population: Californian, with 739,964 calling it home
Number of AI/AN Families in 2009: 1,080,775
Average Number of People in an AI/AN Family in 2009: 3.51
Percentage of AI/AN Householders Who Owned Their Own Home in 2009: 55 percent (compared with 66 percent of the overall population)
Median Value of Homes Owned by AI/AN: $129,800
Percentage of AI/AN 5 and Older Who Speak a Language Other than English at Home: 21 percent
Percentage of AI/AN 25 and Older Who Have at Least a High School Diploma: 80 percent (16 percent have obtained a bachelor’s degree)
Receipts for AI/AN-Owned Businesses in 2007: $34.5 billion
Number of AI/AN-Owned Firms with Paid Employees in 2007: 24,064 (employing 191,472 people)
Median Income of AI/AN Households: $37,348
Percentage of AI/AN in Poverty in 2009: 23.6 percent
Number of AI/AN Veterans of the U.S. Armed Forces: 339,515
Percentage of AI/AN without Health Insurance Coverage: 24.1 percent 11/5/2010
This Facts for Features (CB08-FF.18 Oct. 16, 2008) presents data for American Indians and Alaska Natives, as this is one of the six major race categories. Note: Unless otherwise specified, the data in the “Population” section refer to the population who reported a race alone or in combination with one or more other races.
Population 4.5 million As of July 1, 2007, the estimated population of American Indians and Alaska Natives, including those of more than one race.
They made up 1.5 percent of the total population. <http://www.census.gov/Press– Release/www/releases/archives/population/006808.html>
8.6 million The projected population of American Indians and Alaska Natives, including those of more than one race, on July 1, 2050. They would comprise 2 percent of the total population. Source: Population projections <http://www.census.gov/Press-Release/www/releases/archives/population/012496.html>
44,803 Increase in the nation’s American Indian and Alaska Native population from July 1, 2006, to July 1, 2007.
The population of this group increased by 1 percent during the period. Source: Population estimates <http://www.census.gov/Press-Release/www/releases/archives/population/011910.html>
30.3 Median age of the single-race American Indian and Alaska Native population in 2007, younger than the median of 36.6 for the population as a whole.
About 27 percent of American Indians and Alaska Natives were younger than 18, and 8 percent were 65 and older. Source: Population estimates <http://www.census.gov/Press-Release/www/releases/archives/population/011910.html> 689,120
The American Indian and Alaska Native population in California as of July 1, 2007, the highest total of any state.
California was followed by Oklahoma (393,500) and Arizona (335,381).
About 8,300 American Indians and Alaska Natives were added to Texas’ population between July 1, 2006, and July 1, 2007.
That is the largest numeric increase of any state. Georgia (3.4 percent) had the highest rate of increase during the period. Source: Population estimates <http://www.census.gov/Press-Release/www/releases/archives/population/011910.html> 5
Number of states where American Indians and Alaska Natives were the largest race or ethnic minority group in 2007.
These states are Alaska, Montana, North Dakota, Oklahoma and South Dakota. Source: Population estimates <http://www.census.gov/Press-Release/www/releases/archives/population/011910.html> 11
Number of states with more than 100,000 American Indian and Alaska Native residents on July 1, 2007.
These states were California, Oklahoma, Arizona, Texas, New Mexico, New York, Washington, Florida, North Carolina, Michigan and Alaska. Combined, these states were home to 62 percent of the nation’s American Indian and Alaska Native residents. Source: Population estimates <http://www.census.gov/Press-Release/www/releases/archives/population/011910.html>>
18% About 1 in 5 – The proportion of Alaska’s population identified as American Indian and Alaska Native as of July 1, 2007, the highest rate for this race group of any state. Alaska was followed by Oklahoma (11 percent) and New Mexico (10 percent). Source: Population estimates <http://www.census.gov/Press-Release/www/releases/archives/population/011910.html> 146,500
The number of American Indians and Alaska Natives in Los Angeles County, Calif., as of July 1, 2007. Los Angeles led all of the nation’s counties in the number of people of this racial category. Maricopa County, Ariz., added about 2,300 people to this group between July 1, 2006, and July 1, 2007, leading the nation’s counties in this category. Source: Population estimates <http://www.census.gov/Press-Release/www/releases/archives/population/012463.html>
10 Among counties or equivalents with total populations of 10,000 or more, number that were majority American Indian and Alaska Native, as of July 1, 2007. Shannon, S.D., led the way, with 87 percent of its population being a member of this race group. Source: Population estimates <http://www.census.gov/Press-Release/www/releases/archives/population/012463.html>
Families and Children 537,500
The number of American Indian and Alaska Native families.
314,900 were married-couple families, including those with children.
146,400 were married couples with their own children, under the age of 18. Source: 2007 American Community Survey for the American Indian and Alaska Native alone population <http://factfinder.census.gov>
3.57 Average number of people in an American Indian and Alaska Native family in 2007. This was larger than the national average size for all families (3.2 people). Source: 2007 American Community Survey for the American Indian and Alaska Native alone population <http://factfinder.census.gov>
26% Percentage of Alaska’s preschooler population that was American Indian and Alaska Native, as of July 1, 2005 — the highest proportion of any state.
Housing 56%
The percentage of American Indian and Alaska Native households who owned their own home in 2007. Source: 2007 American Community Survey for the American Indian and Alaska Native alone population <http://factfinder.census.gov>
$116,700 Median value of homes owned by American Indians and Alaska Natives. Source: 2007 American Community Survey for the American Indian and Alaska Native alone population <http://factfinder.census.gov>
Languages 27%
Percentage of American Indians and Alaska Natives 5 years and older who speak a language other than English at home. Source: 2007 American Community Survey for the American Indian and Alaska Native alone population <http://factfinder.census.gov>
Education 76%
The percentage of American Indians and Alaska Natives age 25 and older who have at least a high school diploma.
Also, 13 percent have at least a bachelor’s degree. Source: 2007 American Community Survey for the American Indian and Alaska Native alone population <http://factfinder.census.gov>
61,976 Number of American Indians and Alaska Natives 25 and older who had a graduate or professional degree. Source: 2007 American Community Survey for the American Indian and Alaska Native alone population <http://factfinder.census.gov>
Businesses $26.9 billion
Receipts for American Indian- and Alaska Native-owned businesses in 2002.
These businesses numbered 201,387. 20,380
Number of American Indian- and Alaska Native-owned firms in the Los Angeles-Long Beach-Riverside, Calif., combined statistical area, making that area number one in the metro category. Among counties, Los Angeles had the highest number of firms (13,061).
38,125 Number of American Indian- and Alaska Native-owned firms in California, which led the nation’s states.
Oklahoma, Texas, New York and Florida followed.
Nearly 3-in-10 Ratio of American Indian- and Alaska Native-owned firms which operated in construction and other services (such as personal services, and repair and maintenance).
24,498 Number of American Indian- and Alaska Native-owned firms which had paid employees. These businesses employed 191,270 people.
3,631 Number of American Indian- and Alaska Native-owned firms with receipts of $1 million or more.
These firms accounted for nearly 2 percent of the total number of American Indian and Alaska Native-owned firms and more than 64 percent of their total receipts. 178 Number of American Indian- and Alaska Native-owned firms with 100 or more employees.
These firms generated nearly $5.3 billion in gross receipts — 24 percent of the total revenue for American Indian- and Alaska Native-owned employer firms.
New York; Los Angeles; and Gallup, N.M. The three cities with the largest number of American Indian- and Alaska Native-owned firms, with 7,134; 5,767; and 2,642, respectively. Source for data in this section: American Indian- and Alaska Native-Owned Firms: 2002<http://www.census.gov/Press-Release/www/releases/archives/business_ownership/007013.html>
Jobs 25%
The percentage of civilian employed single-race American Indian and Alaska Native persons age 16 and older who work in management, professional and related occupations. In addition, 23 percent worked in sales and office occupations and about the same percentage worked in service occupations. Source: 2007 American Community Survey for the American Indian and Alaska Native alone population. <http://factfinder.census.gov>
Caregivers 54%
Percentage of American Indians and Alaska Natives 30 and older who lived with grandchildren and were responsible for their care. The corresponding rate for the population as a whole was 40 percent. Source: 2007 American Community Survey for the American Indian and Alaska Native alone population. <http://factfinder.census.gov>
Veterans 165,200
The number of American Indian and Alaska Native veterans of the U.S. armed forces. Source: 2007 American Community Survey for the American Indian and Alaska Native alone population. <http://factfinder.census.gov>
Income and Poverty $35,343
The 2007 median income of households where the householder reported they were American Indian and Alaska Native and no other race. Source: Income, Earnings, and Poverty Data from the 2007 American Community Survey http://www.census.gov/Press-Release/www/releases/archives/income_wealth/012528.html
25.3% The poverty rate of people who reported they were American Indian and Alaska Native and no other race. Source: Income, Earnings, and Poverty Data from the 2007 American Community Survey <http://www.census.gov/Press-Release/www/releases/archives/income_wealth/012528.html>
Health Insurance 32.1%
The percentage of people who reported they were American Indian and Alaska Native and no other race who lacked health insurance coverage, based on a three-year average (2005-2007). Source: Income, Poverty, and Health Insurance Coverage in the United States: 2007, <http://www.census.gov/Press-Release/www/releases/archives/income_wealth/012528.html>
The preceding data were collected from a variety of sources and may be subject to sampling variability and other sources of error.
Facts for Features are customarily released about two months before an observance in order to accommodate magazine production timelines. Questions or comments should be directed to the Census Bureau’s Public Information Office: telephone: 301-763-3030; fax: 301-763-3762; or e-mail: <pio@census.gov>. Source: U.S. Census Bureau | Public Information Office | Last Revised: October 16, 2008
American Indian/Alaska Native Heritage Month Highlights Health Disparities November 2006 is American Indian/Alaska Native Heritage Month.
According to the Census Bureau statistics in 2004 there are an estimated 4.4 million American Indians and Alaska Native people. November is the month when the accomplishments and contributions of the first Americans are honored for their many contributions to American society. But according to the Center for Disease Control website it also highlights a number of health disparities. American Indian/Alaska Native people (AI/ANs) had the 2nd highest diabetes death rate in 2003, the highest death rate from Chronic Liver Disease and Cirrhosis, were 1.5 times more likely to die from unintentional injuries. American Indian and Alaskan Natives teens and young men have the highest suicide rate in the 15 to 24 age group and adult men the second highest rate of suicide after whites (CDC 2004). The top five causes of death are heart disease, cancer, unintentional injuries, diabetes and stroke.